Why does product prioritization often struggle to align with business goals?
Let’s start with this question. We must admit that this is rather an odd problem.
It’s completely understandable that aligning and translating technical scope into business impact is quite challenging. If you doubt that, please try to express in business KPIs the migration to Kubernetes or introducing Kafka as an event stream. Or the simple example of refactoring a monstrous function of 1000 lines of code into a more maintainable design.
But for product scope, that statement is quite surprising. We assume that product goals and key results should reflect directly (or almost directly) the business goals and key results. For example, if the primary business goal is to double last year’s revenue, it is kind of expected that product features chase this goal by directly linking their expected impact with the increased revenue numbers. (It’s a completely different story whether increasing the revenue is the right goal for a company or a product team.)
Perhaps surprisingly, product scope does not neatly align with business goals for many product teams. These teams plan product features that are supposed to move the needle in the right direction, but the business KPIs seem glued to their baseline numbers, hardly moving in the right direction. The product managers are often puzzled: why is that happening? We are relentlessly prioritizing our product features, we believe they should move the needle, but why is that not happening?
Before going deeper into that question and looking at a solution which worked for the product team at DGLegacy®, let’s first do a quick review of the most common ways teams prioritize their scope. We must do this in order to underline a fundamental flaw that they share, which is the root cause of the problem.
Then we’ll show in practical terms how the product team at DGLegacy® fixed that and how different and unexpected the results were.
The most popular prioritization frameworks at a glance.
While there are many quite fancy prioritization frameworks, the most common one is to prioritize based on the expected value to be delivered by the new product feature, and the associated cost.

Value vs. Complexity matrix.
With this prioritization, teams focus on the features that will bring maximum value at the lowest cost, and avoid features that deliver low value at high cost.
With this method, you obtain the prioritization by dividing the value by the cost (effort). Both are often expressed on a scale, for example from 1 to 5, the lowest effort or value being 1, the highest being 5. Of course, there are other ways to express the value and the cost with similar meaning.
Some teams use more sophisticated frameworks, for example, the KANO model. We’ll not explain the model in detail, there are plenty of other sources for that, but basically it tells you not only how to prioritize product capabilities but how much to invest in them.
When I explain the KANO model to junior product managers, I often give them the following example: imagine that we are a team that is building a mid-range car. Can we produce and sell cars without brakes? Obviously not, so we must prioritize brakes. Now that’s clear, but what if our engineering team produces the best-in-class ceramic brakes for our mid-range car? Will the buyers in this segment be willing to pay for these super expensive brakes? Do they need such expensive brakes at all? Again, the answer is clear: with these brakes, our car will become way more expensive and will take longer to produce, and target customers for this class of car won’t be willing to pay for these brakes.
The KANO model gives you the answer to how much you should invest in each product capability, in addition to its prioritization.
Another product prioritization framework is the RICE framework. It takes into account the following factors:
-
- Reach
- Impact
- Confidence
- Effort
It expands the effort and impact prioritization by adding confidence and reach parameters. “Confidence” is self-explanatory – how confident the product team is about the impact, reach and effort of the feature. The “Reach” parameter should reflect how many of your users will be impacted by the product capability. For example, if you are changing your sign-up screen, 100% of your new users will be impacted by that change, while if you are improving a feature deep down in the user journey, it might reach only 5% of your users.
Also, of course, we must discern whether the product improvement affects new users, or old ones, or all of them. This is quite important as, for example, older businesses have a massive number of existing customers, and new customers are a small percentage of that number. It’s the opposite with young startups, which often optimize primarily for new users as they have a very small base of existing ones.
The RICE framework arrives at the priority by multiplying the Reach, Impact and Confidence and dividing them by the Effort.
The ICE framework is similar to RICE. It uses Impact, Confidence and Ease, and as you can guess, “Ease” is the opposite of Effort, so you arrive at the priority by multiplying the 3 values. (Because Ease is the opposite of Effort, you now multiply by it, instead of dividing.) And the ICE framework omits the Reach parameter as Reach gets factored into Impact.
For sure, there are plenty of other prioritization frameworks, such as MoSCoW and Weighted Scoring, but our goal is not to write a book about the existing prioritization frameworks but to quickly summarize the most popular ones. We’ll be able to see a common flaw that they share that leads to a massive misalignment with the business goals and the inability of the prioritized product features to deliver the promised business impact.
We’ll soon see that all these frameworks have something in common – a flaw that is fundamental to the problem that we are trying to solve – so that despite the best efforts of product teams to prioritize using these frameworks, they often don’t see the expected results in the business KPIs.
The short-term view of the existing prioritization frameworks
Instead of explaining the problem theoretically, let’s take a very specific and simple example.
Let’s have two product features, A and B. Let’s prioritize them based on the most simple framework – through their impact and effort. (Then we’ll prioritize the features with the other frameworks, only to see the same results.)
Feature A has impact 3 (on a scale of 1 to 5) and effort 1.
Feature A
Impact: 3
Effort: 1
Prioritization: 3/1 = 3
Feature B
Impact: 4
Effort: 3
Prioritization: 4/3 = 1.33
Having two features, one with prioritization 3 and the other with 1.33, seems like a clear case, doesn’t it? We should prioritize feature A.
Now apply the same data with any of the other prioritization frameworks. Assume that both features have the same confidence, and the same reach. In all cases, feature A will be a clear winner.
Here is the surprise for you.
For the product team at DGLegacy®, the clear winner is feature B, with massively higher priority than feature A. (We’ll quantify that shortly.)
We are certain that feature B is the winner, and we are also certain that if you prioritize feature A over feature B, you’ll be puzzled why you don’t see the business KPIs moving in the right direction.
How can that be true? Isn’t it super obvious that feature A should be prioritized over feature B?
According to most prioritization frameworks, feature A should be prioritized over feature B. But let’s see why the product team at DGLegacy thinks otherwise, and so far, our results confirm our prioritization.
Where is the problem?
In order to see where the problem is, we must go back to our initial puzzle:
Why do product goals and key results often not impact business goals with the intended positive uplift when they are supposed to be strongly aligned?
Let’s take a deeper look into the problem.
– How does a business quantify cost? In dollars, right?
– How does a business quantify impact? Again with dollars, right?
The feasibility of a project at a business level can be elementary, as dollar value return minus dollar value invested. For sure, that’s an oversimplification as there are discounted cash flows and net present value methods for calculating the viability of a business opportunity (or a product feature!), but that simplification is enough for the moment – dollar value return minus dollar value invested.
Objection:
One might argue that some methods, such as net present value, use subtraction for the cost part but others, such as ROI, use division instead. While that’s true, keep in mind that ROI measures the efficiency of an investment.
Let me give a very exaggerated value to my previous example to illustrate this, so that Impact 3 means $3B, while Effort 1 means 1 day (e.g., approximately $1k). Then feature B, accordingly, will bring in $4B (!!!) and cost $3k (3 days). Feature B will bring in $4B vs. $3B for feature A, that’s $1B more, for only $2K additional cost.
Do you still think that feature A will have higher priority?
Usually, profit margin is a constraint requirement (e.g., no less than 15% EBITDA), but the actual goals are most likely related to revenue increase (e.g., increase revenue by 5, keeping the constraint of EBITDA >15%).
In other words, “Our goal is to increase the revenue by X, as long as we keep the gross margin of Y.”
Now let’s look at the existing prioritization frameworks. In our example, Feature A effort is 1, while feature B effort is 3. What does it mean, apart from the fact that Feature A takes 3 times less effort to be implemented than feature B? Is it 1 day vs. 3 days? Is it 1 year vs. 3 years?
The same goes with impact. What do impact 3 and impact 4 mean, apart from the fact that the product team considers that feature B will bring more value than feature A?
Let’s see why these questions are so important and how their answers completely change our prioritization.
We keep all data for Features A and B intact. Let’s assume that the effort for feature A is 1 person month, while the effort for feature B is 3 person months (respecting the ratio of 1:3).
We can already express the effort in dollar value. If we know that 1 person per day costs, for example, $500, the cost for feature A will be approximately $10k, while the cost for feature B will be $30k.
Now let’s look at the value. Let’s assume that feature A will improve our conversion rate for paid plans by 10% and feature B by 13.33% (respecting the existing ratio of the impact of 3:4).
Let’s assume that we have 5 000 new users each month, with a lifetime value of $500 in 5 years per user on average. That applies for both features A and B, of course.
Now let’s calculate, this time from a business perspective, the prioritization of these two features, keeping all initial values intact: the 1:3 cost ratio and 3:4 value ratio.
We have already determined the cost: $10k for feature A and $30k for feature B.
Let’s calculate the value. Before doing so, we need to answer one more question.
How long do we think the effect of the feature will last before, for example, the competition catches up or this feature becomes a commodity?
This is a very important question because the perceived value of a feature is not static. Let’s take the KANO model. When Mercedes Benz invented the airbag, it was a “delighter”, according to the KANO classification; no other car manufacturer in the world had airbags. Within a few years, most car manufacturers had started to offer airbags, so that feature continued to exist but now as a “must-have” hygiene feature, according to the KANO classification. It didn’t bring delight any more, but if you try to sell a car without airbags, people won’t buy it.
All product features that are “delighters” eventually transition to “must-haves” or commodities. A product manager must evaluate, based on the market and the competition, how long the feature can continue to be a delighter.
Let’s assume, in our case, that both features A and B will continue to carry their effect for 3 years.
Now we have all the data to calculate the prioritization of the features again, this time from a business perspective:
Feature A:
Cost: $10k
Conversion before the introduction of feature A: 10% (same for feature B below).
Improvement of conversion rate through feature A: 10%, resulting in a new conversion of 11%. The positive impact of feature A on the total conversion rate is accordingly 1% (10% of 10%).
Value: 36 months value effect (3 years) x 5000 users per month * 0.01 (1% conversion improvement for feature A) * $500 (the lifetime value of the users) = $900k.
Value: $900k
Feature B:
Cost $30k
Conversion before feature B: 10 % (same as feature A).
Improvement of conversion rate through feature B: 13.3%, resulting in conversion of 11.33%. The positive impact of feature B on the total conversion rate is accordingly 1.33% (13.33% of 10%).
Value: 36 months value effect x 5000 users per month * 0.0133 (1.33% conversion improvement for feature B) * $500 (the lifetime value of the users) = $1 197 000
Value: $1 197 000
So the value delivered by feature B is almost $300k more than the value delivered by feature A, while the cost for feature B is only $20k more than the cost for feature A.
Taking now the Impact vs. Cost method, but this time with business impact, we have:
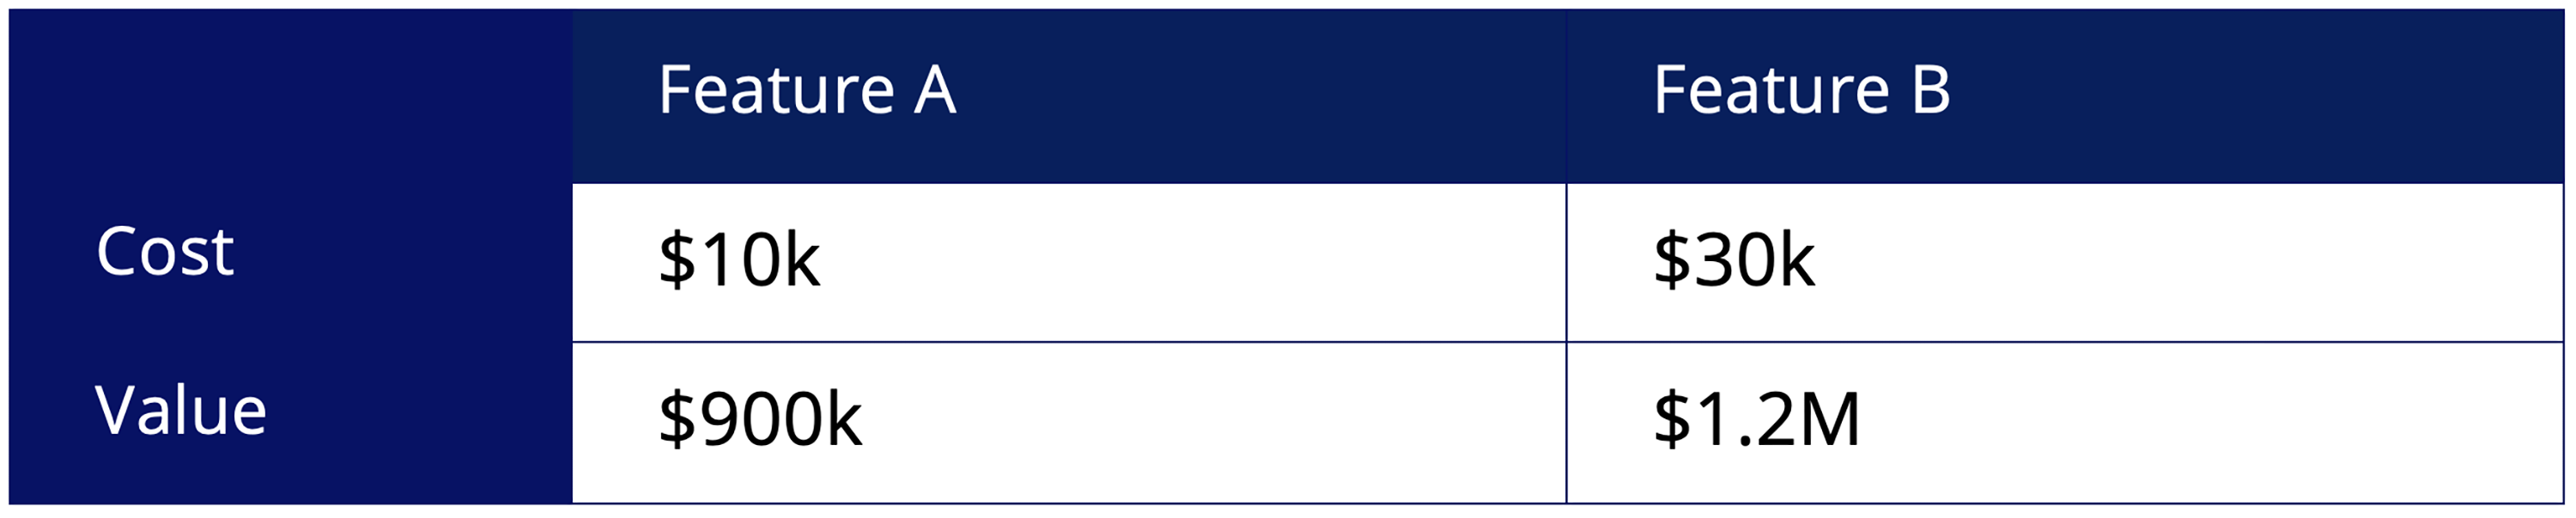
Look at these numbers. Which of them would you choose for your company? While the answer seems clear, the problem lies in the following.
Business people will clearly prioritize feature B (even when they calculate with sophisticated methods like net present value and discounted cash flows).
Product people, using the existing prioritization frameworks, will clearly prioritize feature A (almost 3x higher than feature B!).
This example clearly illustrates the problem. Keep in mind that we didn’t use any extreme cases. You can do this by yourself: take a feature which is 10x (!!!) more expensive than another, but adds 2x more value. The existing prioritization frameworks will end up with 5x higher priority for the feature with the lower cost:
Feature A: value 5, cost 1, priority 5
Feature B: value 10, cost 10, priority 1.
Now apply the business prioritization with real dollar value. Surprise! The 5x goes to the garbage, and feature B is clearly the winner from a business perspective.
Objection:
One important criterion which you should apply is investment runway vs. feature impact date. If the company will run out of money in 1 year, and your feature will start to bring in money after 2 years, that’s obviously a problem – the company won’t exist then.
So you should always consider whether the time-to-impact is aligned with your cash runway.
What just happened? How can that be true?
There are a few reasons for this massive discrepancy between business and product prioritization.
Reason 1: Oversimplification
Using abstractions such as impact and effort (only) is a massive oversimplification.
What if the effort is $1M, and the impact is $10k? Would you still use ratios? No, of course not. It’s clear that such a feature must be abandoned immediately as investing $1M to get $10k is simply nonsense.
Ratios of impact and effort are simply too flawed to evaluate the business impact. As we saw in our examples, they can lead to a favorable prioritization of features that is completely bogus from a business perspective.
Reason 2: Short-term skew
Another problem with most of the existing frameworks is the way they apply the cost (or effort). They usually divide the impact by the cost/effort, as we saw at the beginning of the article.
Why is that a problem?
We saw in our example that most features have a certain lifespan in which they deliver their value until the competition or the market catches up.
The effort, though, does not span that whole period!
Usually, you have a spike in effort at the beginning when you are developing the feature, and then the effort becomes less, primarily expended on maintenance of the feature, e.g., bug fixing.
This second part is not reflected in the product prioritization frameworks (total cost of ownership of the feature), but that’s another problem.
The biggest one is that by dividing the impact by the cost, you assume that the cost will span the whole lifetime of the feature, which is simply wrong. Again, you usually have a spike in effort while implementing the feature, not throughout the lifetime of the feature.
This is well reflected in the business evaluations. There, you subtract, and don’t divide, the effort. This way, you correctly evaluate the cost implications for your business case. Quite the opposite from the existing product prioritization frameworks.
Reason 3: Wrong assumption for the impact
Most prioritization frameworks take a single-digit value for the impact. What does 3 mean? Or 4? Or 7?
That is just too ridiculous to assume for an impact. First, impact has a dollar value. Second, that dollar value depends largely on the lifespan of the feature. If your feature will bring in $10k per month, will that continue for 6 months? Or 3 years? The evaluation of the impact of the feature will largely depend on the answer to this question. Simply taking a random kindergarten number such as 3 or 4 is too much of an oversimplification to quantify any business value.
How to fix the problem: the HICE framework
One solution to the problem is to use hard dollar value when prioritizing. We must admit that it’s sometimes difficult or too complicated to be used by each product team. When we do an optimization of our sign up page or onboarding journey, we might be able to quantify the potential business value (dollar impact) behind our product improvement hypothesis, but often, when we make minor improvements to the user experience, that’s not really possible.
But then at DGLegacy®, we were puzzled by how to fix the problem. On one hand, we saw the flaw of the existing prioritization frameworks, and on the other hand, using dollar value for prioritization for each product feature was too demanding, and sometimes just impossible.
What could we do? Our product team at DGLegacy® has adopted a new prioritization framework which still uses value and cost, which are abstractions of the real dollar values.
But we have made some important changes so the impact and cost parameters are much closer to the real business numbers.
Let’s see how we have achieved that.
Adding the long-term effect of the product feature
To do so, we have introduced three important changes:
HTC – Hard To Copy variable
This is the number of weeks, months or hopefully years that the product team assesses that the feature will be a “delighter” that will bring a positive effect until the competition or the market catches up. Or, to put it simply, the lifetime of the feature until it becomes a commodity for which customers will have low or zero willingness to pay.
A few examples. We launched a Family Account feature which enables DGLegacy® users to add family members and collaborate in managing their family assets. Our hard-to-copy value is 24 months: most of our competitors don’t have such capability, or they have but it delivers far less value than ours. But at the same time, we realized that it won’t take much longer than 2 years before some of our competitors catch up with that.
We set hard-to-copy values to every one of our features, and it’s not an abstract value, such as magical 1, 2, etc., but actual person months.
Effort
In addition to this, we have made one other important change. As in the business cases, we subtract the cost from the total value, rather than dividing it. The division by the effort skews the prioritization towards the short-term view, assuming that the cost is carried throughout the lifespan of the feature. With the subtraction, we are much closer to a real-world business evaluation of the cost over the benefit of the features.
For effort, again we use personal months. For smaller features, we use person weeks or, for some very small features, even person days, but we always make sure that the hard-to-copy type of period (days, weeks or months) matches the one used for the effort – we want to compare apples with apples. 🙂
Impact
While impact is present in other frameworks as well, we have already demonstrated that simply coming up with a number such as 1 or 2 is a massive oversimplification (apart from not really knowing what 3 means), which leads to a deviation from the real business prioritization.
At the same time, of course, we can’t simply omit the impact. It’s one of the most important characteristics of a product feature – what its impact will be over the business goals.
The team at DGLegacy made the following change to that metric. Impact is still represented by a number, from 1 (lowest) to 10 (highest), but it’s calculated in the following way:
-
- The team has a clear goal (for the quarter in our case, but it could be for any defined period), which is usually the improvement of a certain conversion rate or the number of users, etc. At the end, the goal boils down to either a % increase or to a number increase.
- Having that goal as a baseline (for example, improve the activation rate by 10%, or the sign-up rate by 5%), the team comes up with how much the proposed feature is supposed to move that team goal.
As an example, if the goal is to improve the conversion rate by 5%, and our hypothesis is that the feature will improve the conversion rate by 1%, the Impact value is 2 (the feature impact divided by the overall goal, multiplied by 10).
The impact value can range from zero (if the feature doesn’t improve the goal at all) to 10 (if the feature fully achieves the team goal). For example, if, in our example above, the planned impact of the feature is to improve the conversion rate by 5%, the value will be 5/5 * 10 = 10.
This way, we do have a much closer relationship between the planned impact of the product feature and the planned business impact. Rather than guessing a number (e.g., 2), we have an impact that correlates with the planned business goal of the team.
You might well say that there is a difference between the “planned” and the achievable result. That’s absolutely true! To reflect on that, we do keep the Confidence parameter (see below), which reflects the confidence level of the team that the feature will actually reach its planned result.
Then, from simple mathematics, you can see that these two characteristics (Impact and Confidence) have a balancing impact on our prioritization. Having a feature with impact 5 and confidence level 10 has exactly the same prioritization (everything else being equal) as a feature with impact 10 and confidence level 5. (If you plan many features with planned impact and confidence level 5, you’ll inevitably end up with an average impact of 5, the same as the feature with confidence level 10 and impact 5).
By making these three changes, we’ve come up with our framework,
HICE:
H – Hard to copy
Number of days/weeks/months/years for which the product feature will be a “delighter.”
I – Impact
Calculated by the method described above.
C – Confidence
Percentage value of how confident we are that the feature will bring the desired business impact. This is very important, as this parameter enables us to balance between moon shots (high impact, low confidence) and steady product improvements (moderate impact, high confidence). And we must be honest with ourselves – this is the least objective of all criteria and requires alignment within the Product team.
E – Effort
Person days/weeks/months. It’s important that the effort has the same type of period as the hard-to-copy value.
The priority is determined by:
(Hard to copy* Impact * Confidence) – Effort
Suggestion: you can take one or two random product features from your backlog, proritize them with some of the traditional prioritization methods, for example, cost vs. impact, and then prioritize with the HICE framework.
Did you achieve different prioritizations? Which of them do you think relates better to the business priorities of your team?
Two practical examples from DGLegacy
Now we want to show how we apply the prioritization practically in our daily work. For that purpose, we’ll use two specific product capabilities, one for quite a small feature and the other for a large one.
In this way, we will demonstrate that the HICE framework can be easily used in daily work no matter the size of the features.
Feature #1
Description:
DGLegacy needs to send reminders to the users, for example, when their credit cards are about to expire, so that the users have peace of mind that their assets are up to date.
Effort: 1 person month (1/12 year)
Impact: 2
Team goal is to improve user engagement by 10%. There is a clear definition of “engagement” for the team.
The team plans that this feature will improve the engagement by 2%:
The Impact is 2/10 * 10 = 2.
Confidence: 5
The team has 50% confidence that the feature will achieve the actual goal.
Hard to copy: 6 months (½ year)
As it’s generally a very easy feature to be copied by any of our competitors, we don’t think that the lifetime will be very long.
Resultant priority for feature #1 (We convert from months to years for consistent prioritization across all features.)
0.5 (H) * 2 (I) * 5 (C) * – 0.08 (E) = 5
Feature #2
Description:
DGLegacy wishes to implement a family account so that multiple members of one family can manage and protect their family assets.
Estimated effort: 6 person months (½ year)
Impact: 4
Using the same mechanism as with feature #1.
Confidence: 3
If people use the family account, it will have a significant impact on the team engagement goal. Still, through user research, the team has 30% confidence that the users will use that capability, as not all people who use digital legacy management services are willing to do this in collaboration with family members, due to confidentiality and sensitivity considerations.
Hard to copy: 24 months (2 years)
This is a relatively complex feature to be implemented by our competitors.
Resultant priority for feature #2: (again converted to years)
2 (HC) * 4 (I) * 3 (C) – 0.5 (E) = 25.5
By using the framework, it’s easy to see that feature #2 has a massive advantage over feature #1.
It’s interesting, though, to see what the result would be if we used the predominant impact vs. effort prioritization method.
You can easily see that, in that case, the prioritization would be completely different – feature #1 would have a significantly higher priority that feature #2!
The priority of feature one will be 2/1 (impact divided by effort) = 2.
The priority of feature two will be 4/6 = 0.6.
Traditional prioritization frameworks put the priority of feature #1 three times higher than feature #2!
With HICE, it’s completely the opposite: feature #2 has much higher priority than feature #1. And guess what? When you do a business evaluation, feature #2 is again the clear winner, contrary to the product framework’s result.
Isn’t it skewed now only to long-term investments?
One might argue that our framework will always push forward long-term features, or even moon shots with massive long-term potential. That might be the argument if your product and engineering teams are working only on features with high effort and long, hard-to-copy periods that will yield results after several years. And that, in turn, might lead to significant financial risk for the company.
Sounds logical, right? If we focus only on long-term (high effort) and hard-to-copy features, who will earn money this month, next month, etc., until these features are delivered?
Sounds logical, right?
Not at all! 🙂
Anyone who has basic project management skills knows that the higher the estimation is, the lower the confidence is (in the estimation, as well as in the result).
I won’t go into project management fundamentals, and why it’s so important that product managers are also very good project managers, because that’s another topic.
But that basic project management principle means that if we plan only for long-term (high effort) features, our confidence level will become progressively lower. And that will have the effect of balancing the prioritization, restricting the team from prioritizing only long-term moon shots.
Is there a difference between startups and established firms?
Definitely a valid question. One characteristic of startups is that you usually want the features to have an impact in no more than 6 months.
As a result, product managers in startups usually prioritize features that will have an impact in less than 6 months. You remember that we discussed above the constraint of cash runway of a startup company: if you have cash for 1 more year, it doesn’t make sense to prioritize features that will bring in revenue after that period.
In established companies, product managers have more freedom. It’s not drastically different from startups, as even in profitable, established companies, you usually have yearly objectives, which are …. yearly 😀.
Still, the profitability of established companies allows product managers to prioritize longer-term features as well, especially if the company culture supports that.
Conclusion
You might wonder why the existing frameworks for product prioritization have such different results from the business prioritization. As we saw, the primary reason is that they oversimplify the business KPIs; they are, as a result, poorly aligned with them and are skewed toward short-term focus.
Coming up with a single number, for example 3, on a scale from 1 to 5, is way too much of an oversimplification for the potential business impact or cost that a feature can have. You simply omit so many considerations, such as the period during which the feature will deliver value and the lifetime of the users who will benefit from that feature, which inevitably ends up in plain wrong prioritization.
We hope that by using HICE, you will be able to avoid these problems and have better prioritization in your team!
Keep in mind that this is work in progress; we are continuously evaluating the results from applying the framework and improving it as we go.
One very important consideration which we have already mentioned is that you should always take into consideration the cash runway of the company: you can’t prioritize long-term features if you have a cash runway of only a few months.
My humble suggestion: please don’t assume that anything tech or product-related is perfect. Always ask critical questions, evaluate the results, and try to improve.
If you have any suggestions as to how the framework can be improved, or you have results from applying it in your own teams, please reach out to me.